When it comes to browser DevTools, we all have our own preferences and personal workflows, and we pride ourselves in knowing that “one little trick” that makes our debugging lives easier.
But also — and I know this from having worked on DevTools at Mozilla and Microsoft for the past ten years — most people tend to use the same three or four DevTools features, leaving the rest unused. This is unfortunate as there are dozens of panels and hundreds of features available in DevTools across all browsers, and even the less popular ones can be quite useful when you need them.
As it turns out, I’ve maintained the DevTools Tips website for the past two years now. More and more tips get added over time, and traffic keeps growing. I recently started tracking the most popular tips that people are accessing on the site, and I thought it would be interesting to share some of this data with you!
So, here are the top 15 most popular DevTools tips from the website.
If there are other tips that you love and that make you more productive, consider sharing them with our community in the comments section!
Let’s count down, starting with…
15: Zoom DevTools
If you’re like me, you may find the text and buttons in DevTools too small to use comfortably. I know I’m not alone here, judging by the number of people who ask our team how to make them bigger!
Well, it turns out you can actually zoom into the DevTools UI.
DevTools’ user interface is built with HTML, CSS, and JavaScript, which means that it’s rendered as web content by the browser. And just like any other web content in browsers, it can be zoomed in or out by using the Ctrl+ and Ctrl- keyboard shortcuts (or Cmd+ and Cmd- on macOS).
So, if you find the text in DevTools too small to read, click anywhere in DevTools to make sure the focus is there, and then press Ctrl+ (or Cmd+ on macOS).
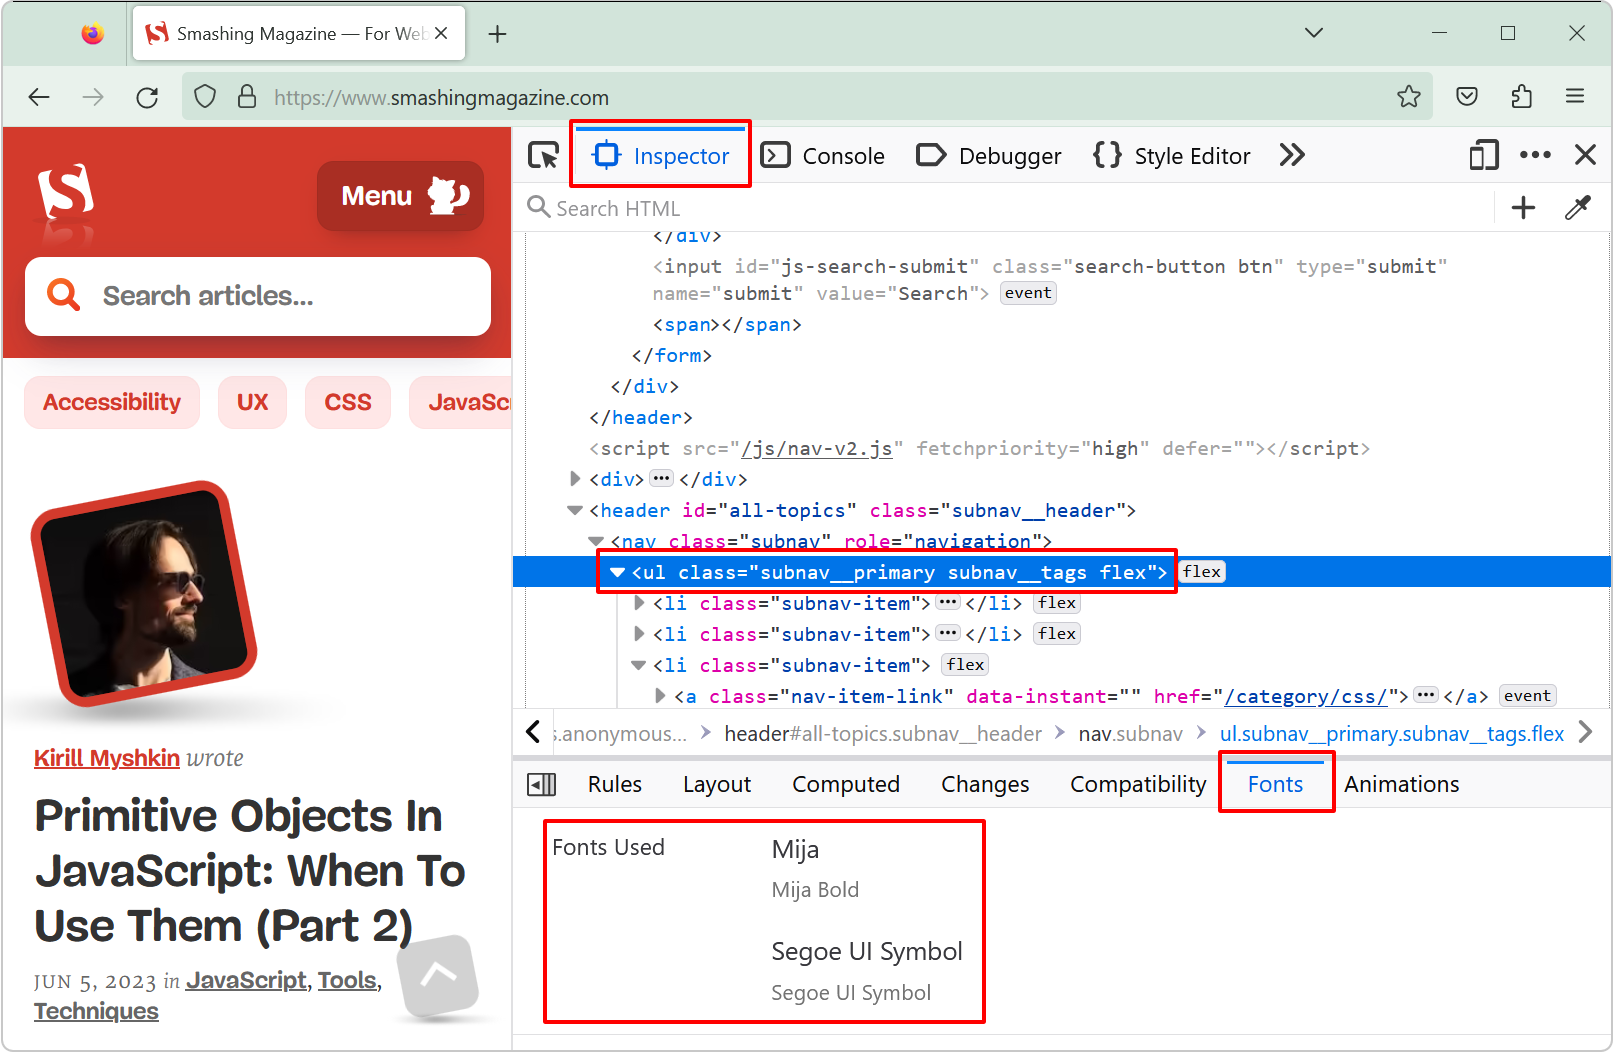
Chromium-based browsers such as Chrome, Edge, Brave, or Opera can also display the font used by an element that contains the text:
- Select an element that only contains text children.
- Open the Computed tab in the sidebar of the Elements tool.
- Scroll down to the bottom of the tab.
- The rendered fonts are displayed.
Note: To learn more, see “List the fonts used on a page or an element.”
12: Measure Arbitrary Distances On A Page
Sometimes it can be useful to quickly measure the size of an area on a webpage or the distance between two things. You can, of course, use DevTools to get the size of any given element. But sometimes, you need to measure an arbitrary distance that may not match any element on the page.
When this happens, one nice way is to use Firefox’s measurement tool:
- If you haven’t done so already, enable the tool. This only needs to be done once: Open DevTools, go into the Settings panel by pressing F1 and, in the Available Toolbox Buttons, check the Measure a portion of the page option.
- Now, on any page, click the new Measure a portion of the page icon in the toolbar.
- Click and drag with the mouse to measure distances and areas.
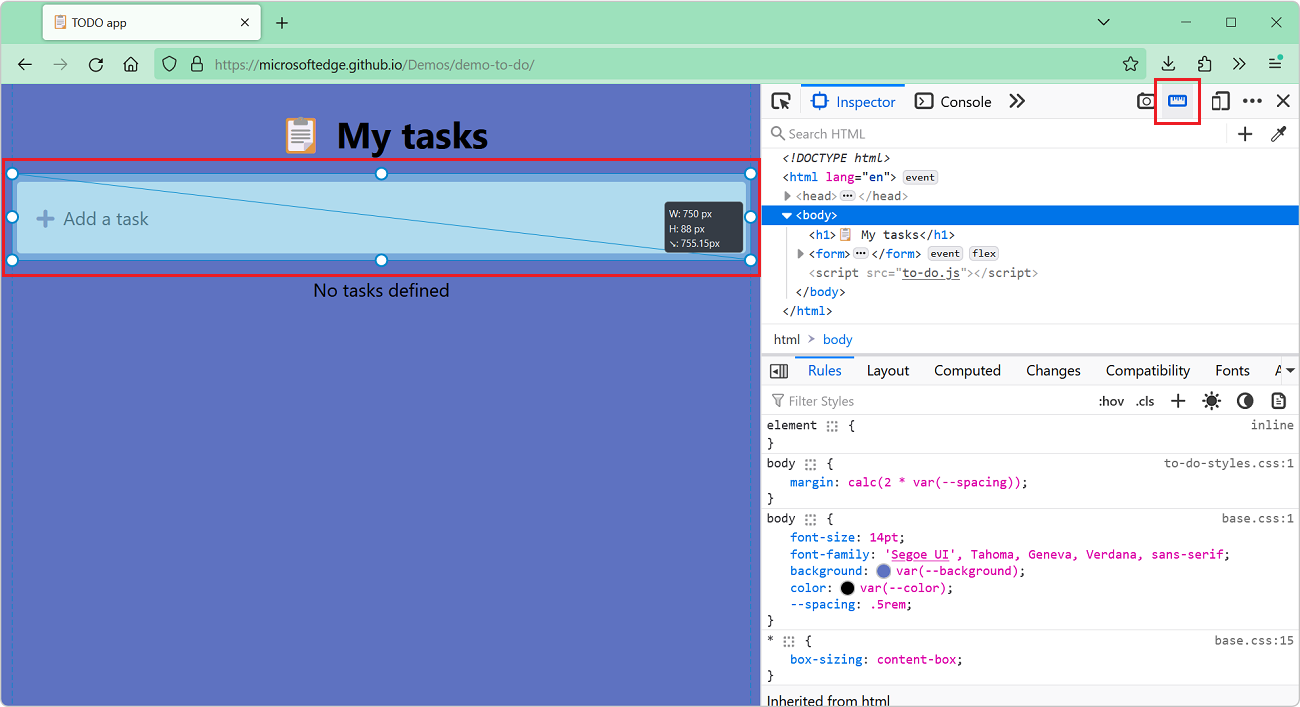
Note: To learn more, see “Measure arbitrary distances in the page.”
11: Detect Unused Code
One way to make a webpage appear fast to your users is to make sure it only loads the JavaScript and CSS dependencies it truly needs.
This may seem obvious, but today’s complex web apps often load huge bundles of code, even when only a small portion is needed to render the first page.
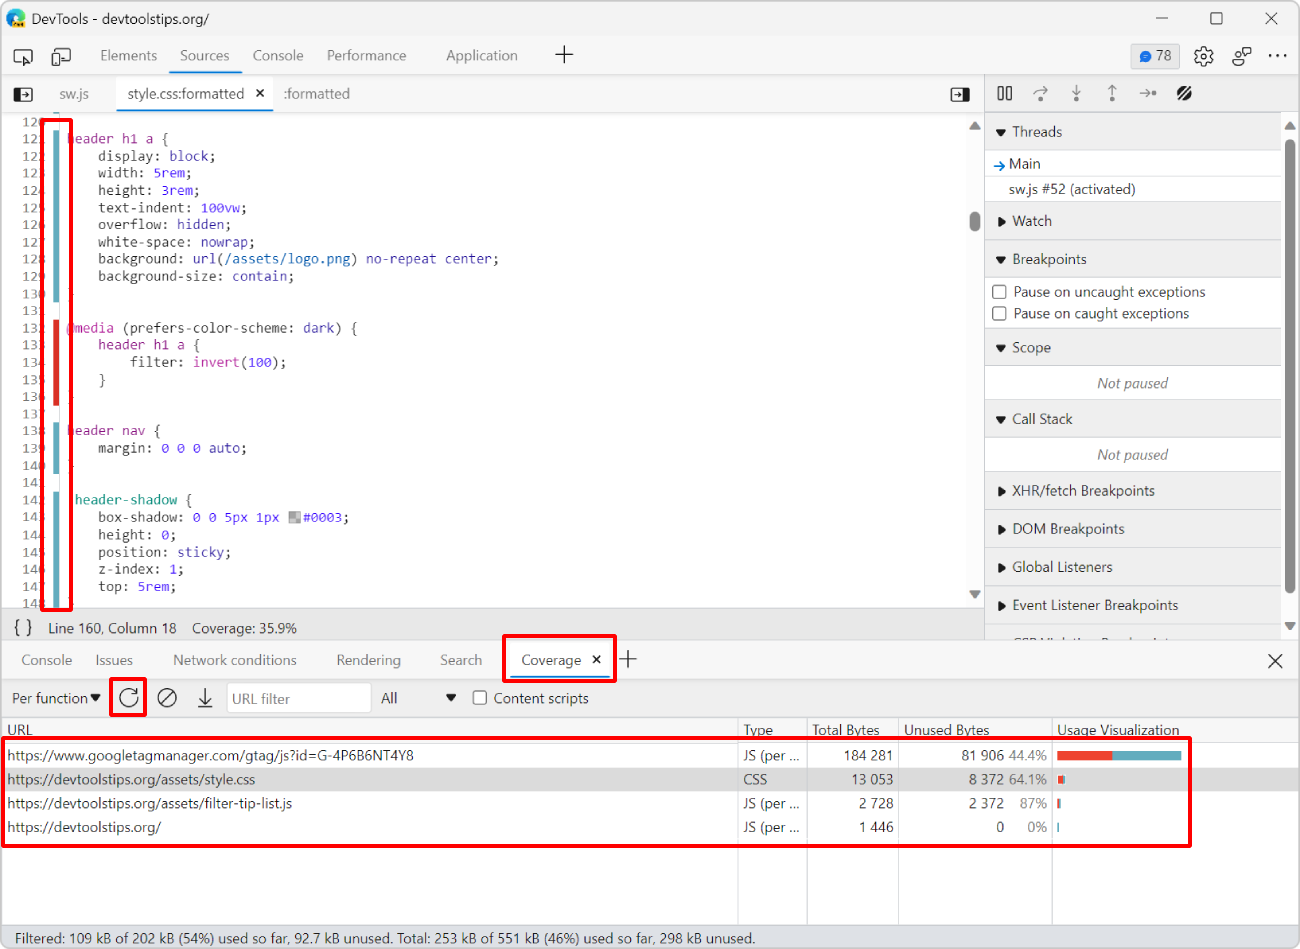
In Chromium-based browsers, you can use the Coverage tool to identify which parts of your code are unused. Here is how:
- Open the Coverage tool. You can use the Command Menu as a shortcut: press Ctrl+Shift+P (or Cmd+Shift+P on macOS), type “coverage” and then press Enter.)
- Click Start instrumenting coverage and refresh the page.
- Wait for the page to reload and for the coverage report to appear.
- Click any of the reported files to open them in the Sources tool.
The file appears in the tool along with blue and red bars that indicate whether a line of code is used or unused, respectively.
Note: To learn more, see “Detect unused CSS and JavaScript code.”
10: Change The Playback Rate Of A Video
Usually, when a video appears on a webpage, the video player that displays it also provides buttons to control its playback, including a way to speed it up or slow it down. But that’s not always the case.
In cases when the webpage makes it difficult or impossible to control a video, you can use DevTools to control it via JavaScript istead.
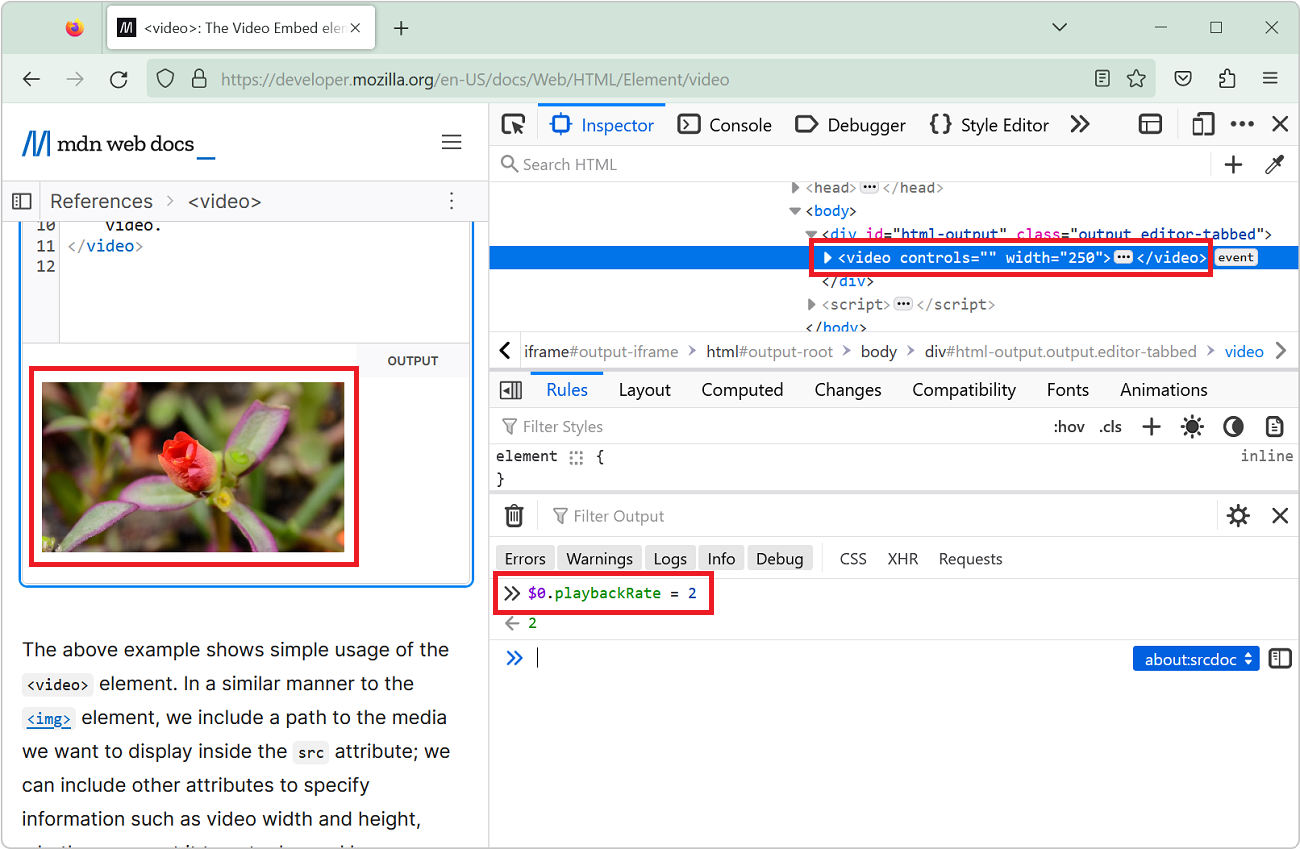
- Open DevTools.
- Select the
<video>element in the Elements tool (called Inspector in Firefox). - Open the Console tool.
- Type the following:
$0.playbackRate = 2;and press Enter.
The $0 expression is a shortcut that refers to whatever element is currently selected in DevTools; in this case, it refers to the <video> HTML element.
By using the playbackRate property of the <video> element, you can speed up or slow down the video. Note that you could also use any of the other <video> element properties or methods, such as:
$0.pause()to pause the video;$0.play()to resume playing the video;$0.loop = trueto repeat the video in a loop.
Note: To learn more, see “Speed up or slow down a video.”
9: Use DevTools In Another Language
If, like me, English isn’t your primary language, using DevTools in English might make things harder for you.
If that’s your case, know that you can actually use a translated version of DevTools that either matches your operating system, your browser, or a language of your choice.
The procedure differs per browser.
In Safari, both the browser and Web Inspector (which is what DevTools is called in Safari) inherit the language of the operating system. So if you want to use a different language for DevTools, you’ll need to set it globally by going into System preferences → Language & Region → Apps.
In Firefox, DevTools always matches the language of the browser. So, if you want to use DevTools in, say, French, then download Firefox in French.
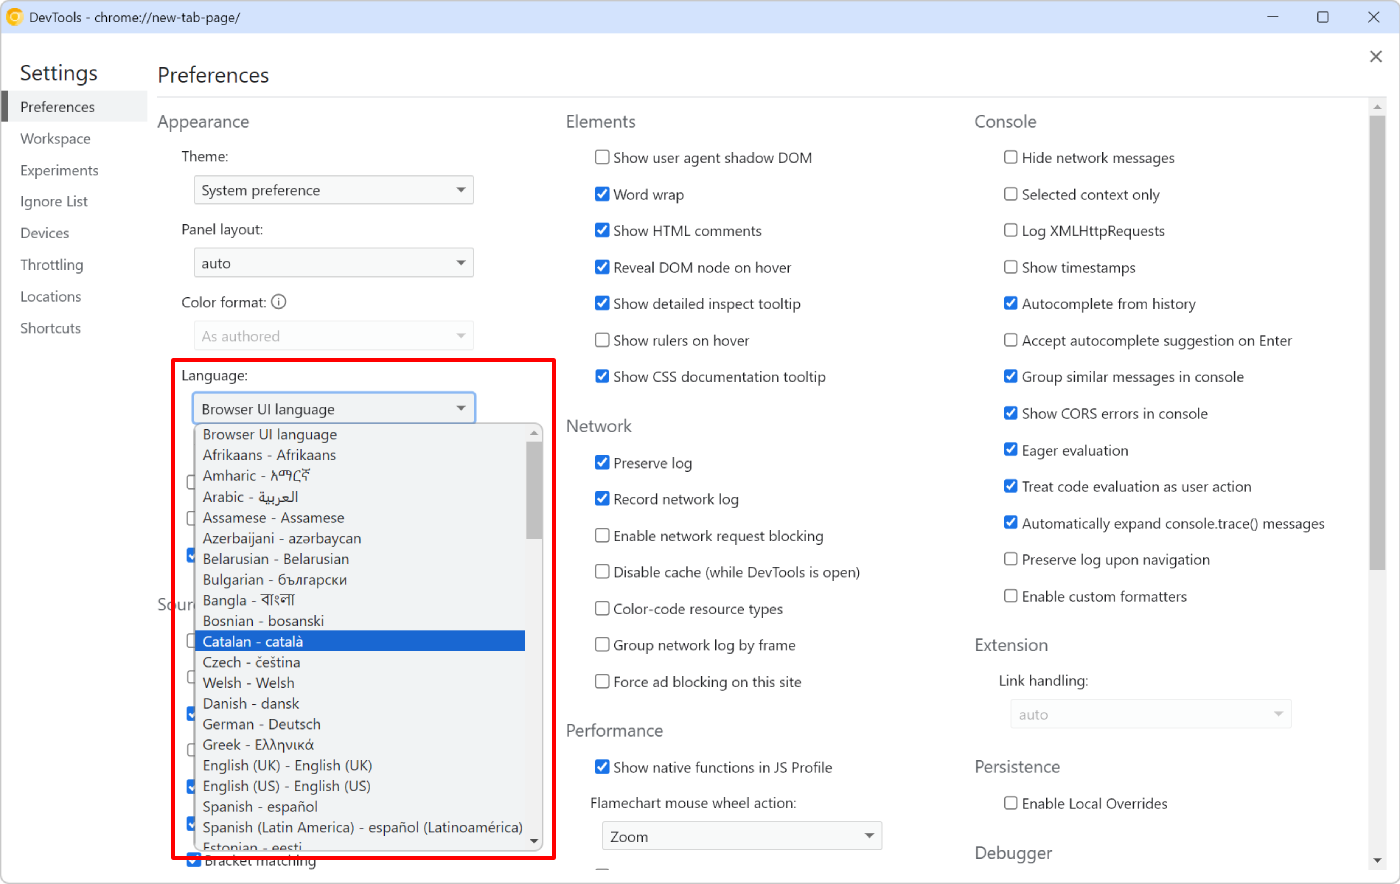
Finally, in Chrome or Edge, you can choose to either match the language of the browser or set a different language just for DevTools.
To make your choice:
- Open DevTools and press F1 to open the Settings.
- In the Language drop-down, choose either Browser UI language to match the browser language or choose another language from the list.
Note: To learn more, see “Use DevTools in another language.”
8: Disable Event Listeners
Event listeners can sometimes get in the way of debugging a webpage. If you’re investigating a particular issue, but every time you move your mouse or use the keyboard, unrelated event listeners are triggered, this could make it harder to focus on your task.
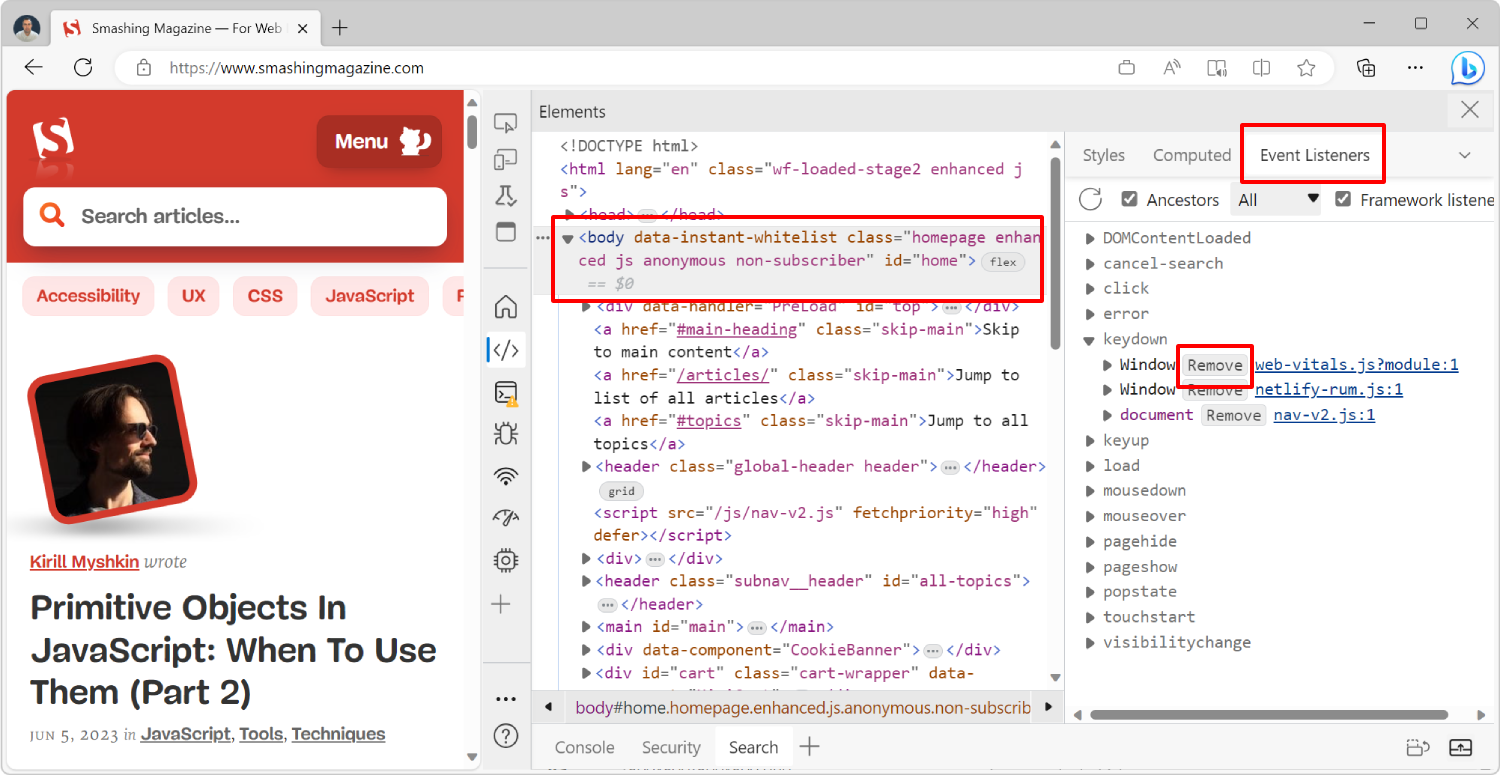
A simple way to disable an event listener is by selecting the element it applies to in the Elements tool (or Inspector in Firefox). Once you’ve found and selected the element, do either of the following:
- In Firefox, click the event badge next to the element, and in the popup that appears, uncheck the listeners you want to disable.
- In Chrome or Edge, click the Event Listeners tab in the sidebar panel, find the listener you want to remove, and click Remove.
Note: To learn more, see “Remove or disable event listeners.”
7: View Console Logs On Non-Safari Browsers On iOS
As you might know, Safari isn’t the only browser you can install and use on an iOS device. Firefox, Chrome, Edge, and others can also be used. Technically, they all run on the same underlying browser rendering engine, WebKit, so a website should more or less look the same in all of these browsers in iOS.
However, it’s possible to have bugs on other browsers that don’t replicate in Safari. This can be quite tricky to investigate. While it’s possible to debug Safari on an iOS device by attaching the device to a Mac with a USB cable, it’s impossible to debug non-Safari browsers.
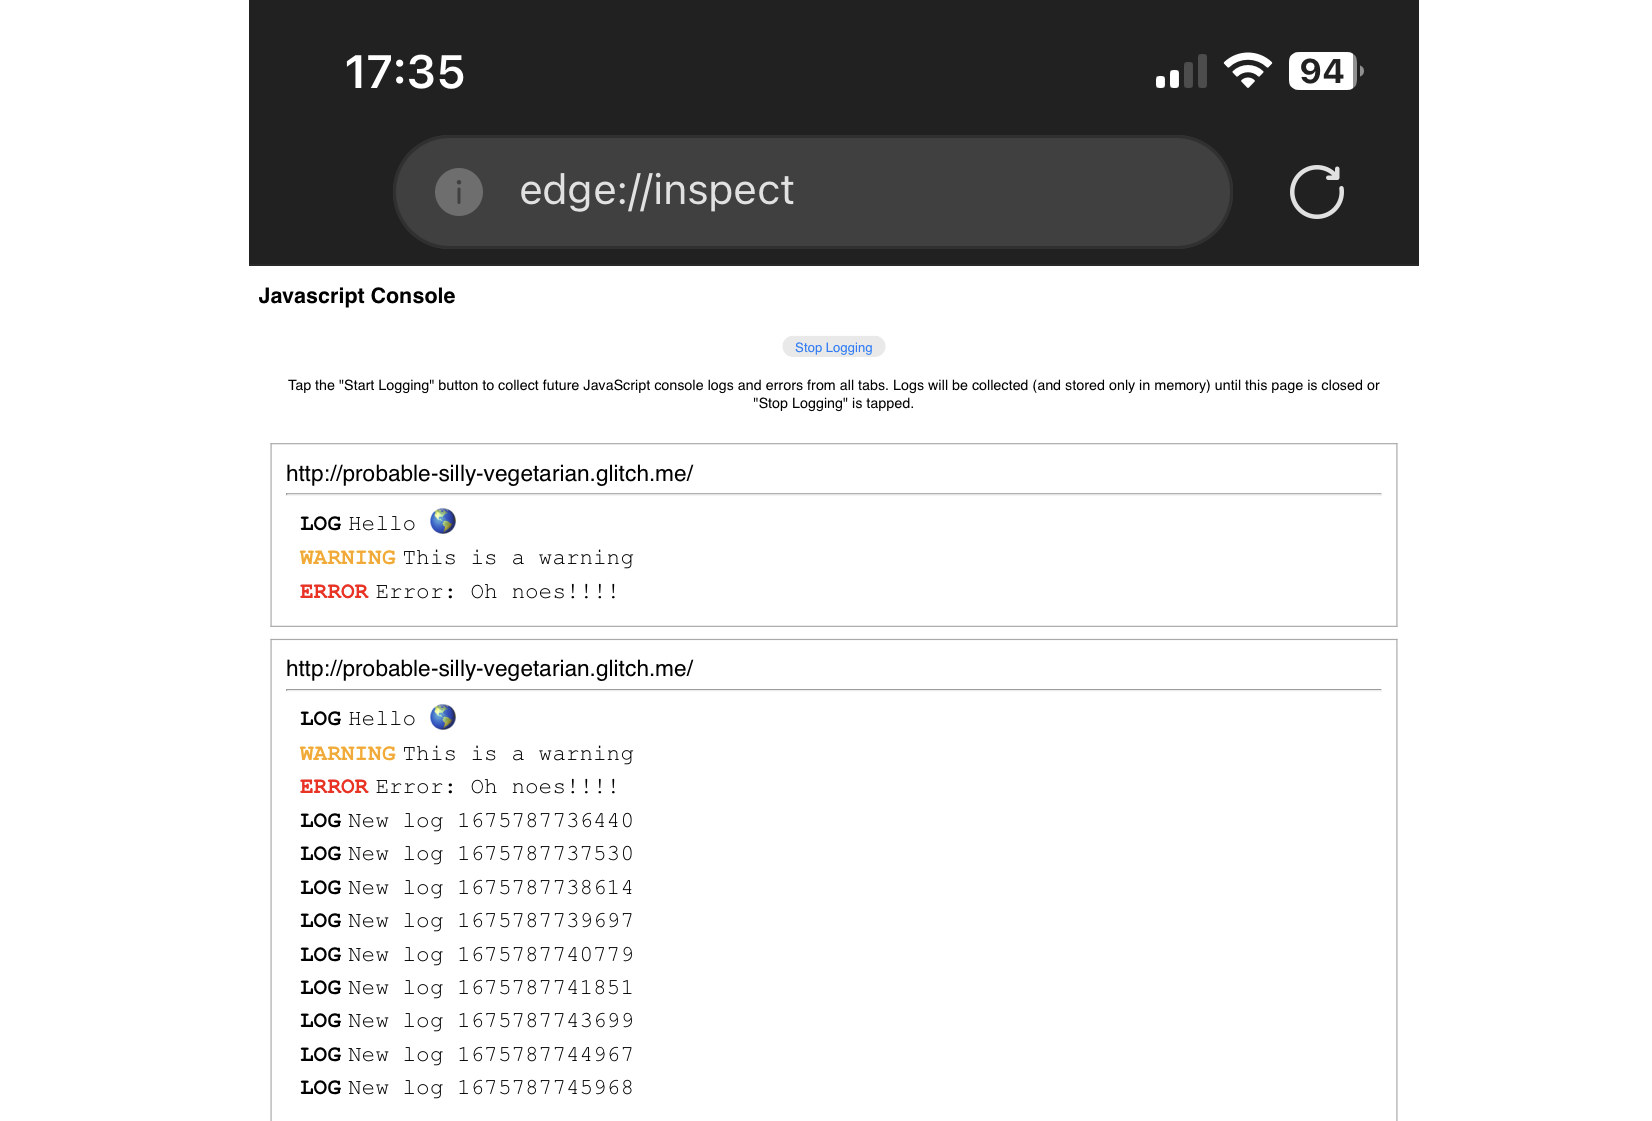
Thankfully, there is a way to at least see your console logs in Chrome and Edge (and possibly other Chromium-based browsers) when using iOS:
- Open Chrome or Edge on your iOS device and go to the special
about:inspectpage. - Click Start Logging.
- Keep this tab open and then open another one.
- In the new tab, go to the page you’re trying to debug.
- Return to the previous tab. Your console logs should now be displayed.
Note: To learn more, see “View console logs from non-Safari browsers on an iPhone.”
6: Copy Element Styles
Sometimes it’s useful to extract a single element from a webpage, maybe to test it in isolation. To do this, you’ll first need to extract the element’s HTML code via the Elements tool by right-clicking the element and choosing Copy → Copy outer HTML.
Extracting the element’s styles, however, is a bit more difficult as it involves going over all of the CSS rules that apply to the element.
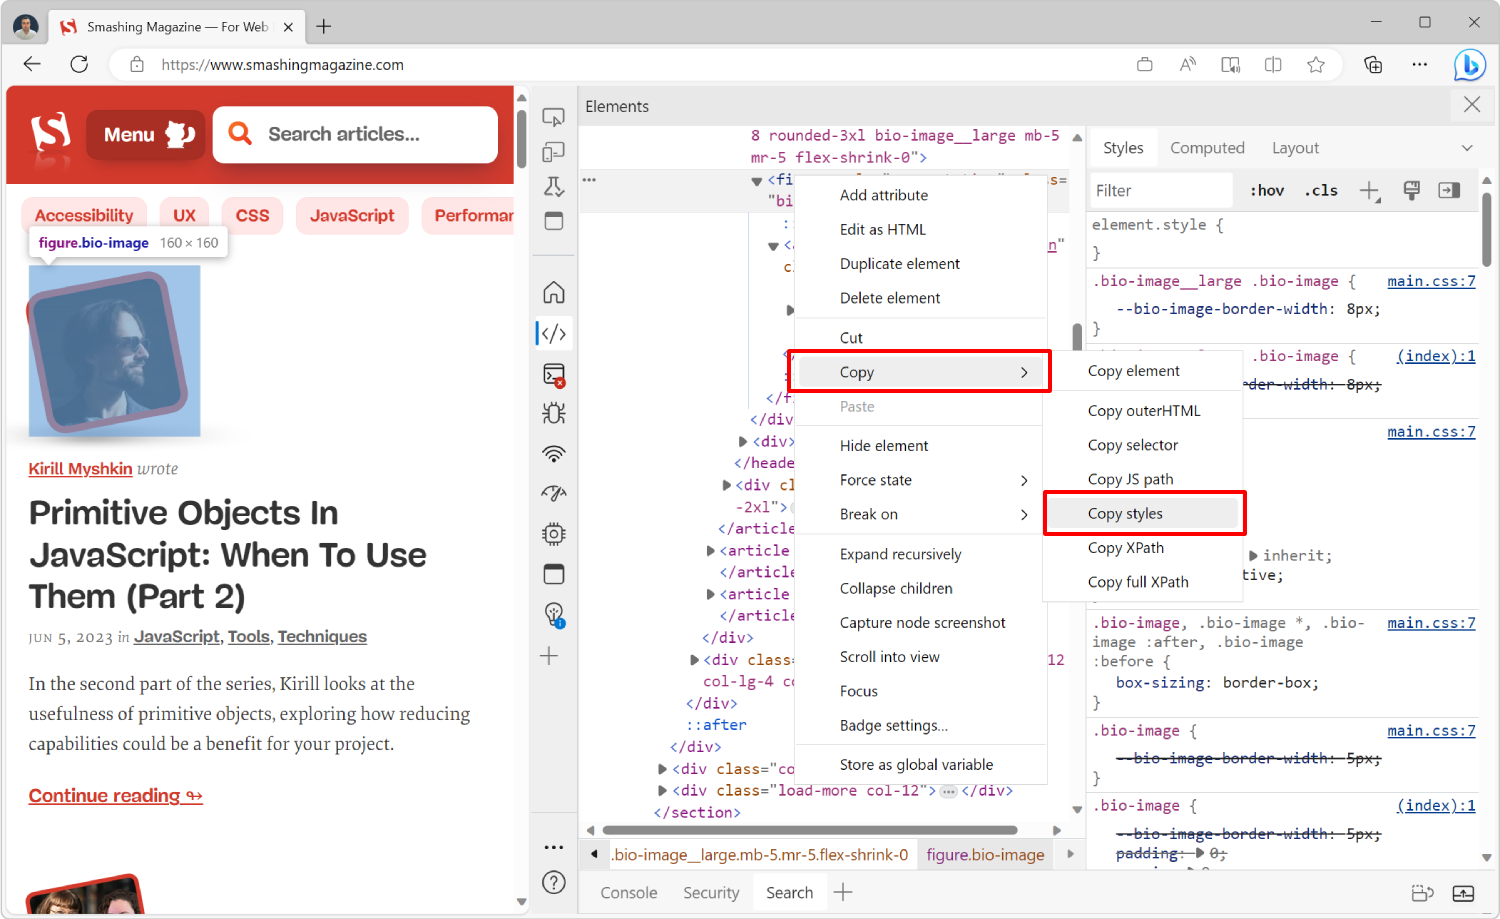
Chrome, Edge, and other Chromium-based browsers make this step a lot faster:
- In the Elements tool, select the element you want to copy styles from.
- Right-click the selected element.
- Click Copy → Copy styles.
- Paste the result in your text editor.
You now have all the styles that apply to this element, including inherited styles and custom properties, in a single list.
Note: To learn more, see “Copy an element’s styles.”
5: Download All Images On The Page
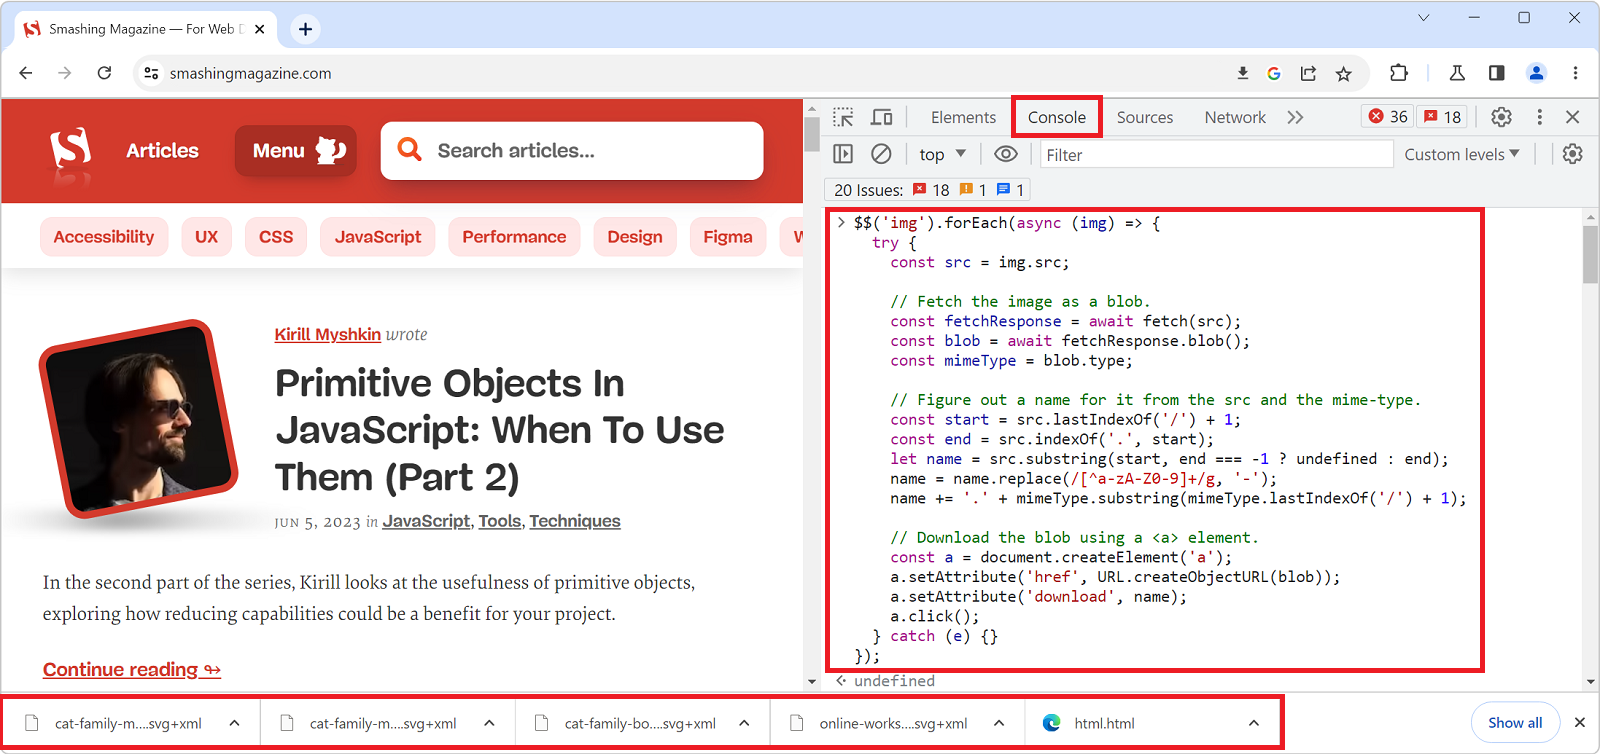
This nice tip isn’t specific to any browser and can be run anywhere as long as you can execute JavaScript. If you want to download all of the images that are on a webpage, open the Console tool, paste the following code, and press Enter:
$$('img').forEach(async (img) => { try { const src = img.src; // Fetch the image as a blob. const fetchResponse = await fetch(src); const blob = await fetchResponse.blob(); const mimeType = blob.type; // Figure out a name for it from the src and the mime-type. const start = src.lastIndexOf('/') + 1; const end = src.indexOf('.', start); let name = src.substring(start, end === -1 ? undefined : end); name = name.replace(/[^a-zA-Z0-9]+/g, '-'); name += '.' + mimeType.substring(mimeType.lastIndexOf('/') + 1); // Download the blob using a <a> element. const a = document.createElement('a'); a.setAttribute('href', URL.createObjectURL(blob)); a.setAttribute('download', name); a.click(); } catch (e) {}
});
Note that this might not always succeed: the CSP policies in place on the web page may cause some of the images to fail to download.
If you happen to use this technique often, you might want to turn this into a reusable snippet of code by pasting it into the Snippets panel, which can be found in the left sidebar of the Sources tool in Chromium-based browsers.
In Firefox, you can also press Ctrl+I on any webpage to open Page Info, then go to Media and select Save As to download all the images.
Note: To learn more, see “Download all images from the page.”
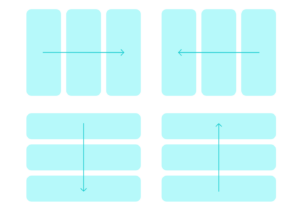
4: Visualize A Page In 3D
The HTML and CSS code we write to create webpages gets parsed, interpreted, and transformed by the browser, which turns it into various tree-like data structures like the DOM, compositing layers, or the stacking context tree.
While these data structures are mostly internal in-memory representations of a running webpage, it can sometimes be helpful to explore them and make sure things work as intended.
A three-dimensional representation of these structures can help see things in a way that other representations can’t. Plus, let’s admit it, it’s cool!
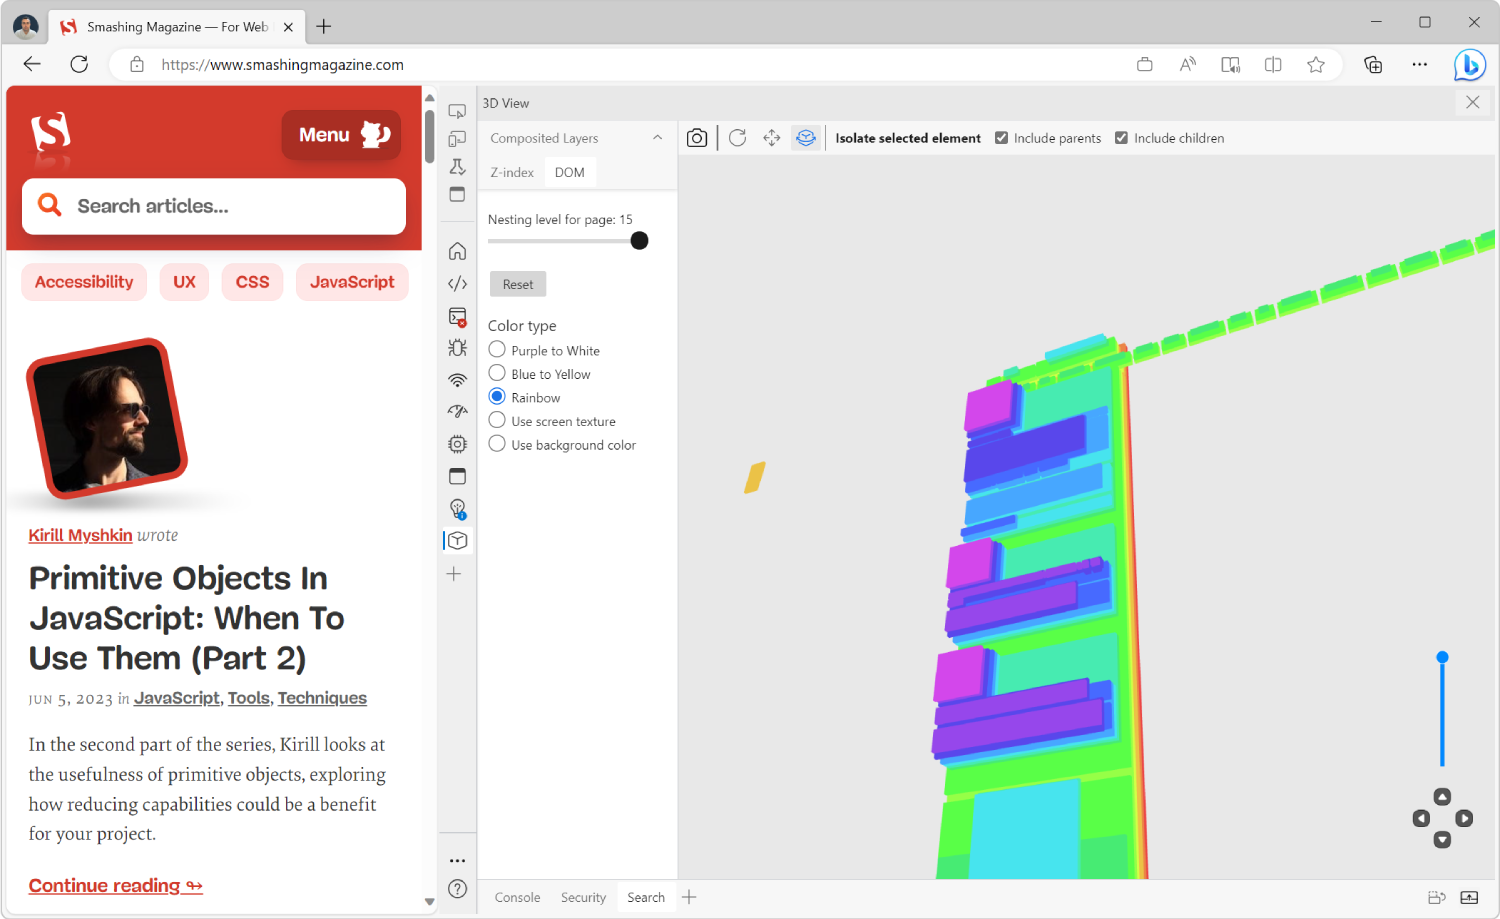
Edge is the only browser that provides a tool dedicated to visualizing webpages in 3D in a variety of ways.
- The easiest way to open it is by using the Command Menu. Press Ctrl+Shift+P (or Cmd+Shift+P on macOS), type “3D” and then press Enter.
- In the 3D View tool, choose between the three different modes: Z-Index, DOM, and Composited Layers.
- Use your mouse cursor to pan, rotate, or zoom the 3D scene.
The Z-Index mode can be helpful to know which elements are stacking contexts and which are positioned on the z-axis.
The DOM mode can be used to easily see how deep your DOM tree is or find elements that are outside of the viewport.
The Composited Layers mode shows all the different layers the browser rendering engine creates to paint the page as quickly as possible.
Consider that Safari and Chrome also have a Layers tool that shows composited layers.
Note: To learn more, see “See the page in 3D.”
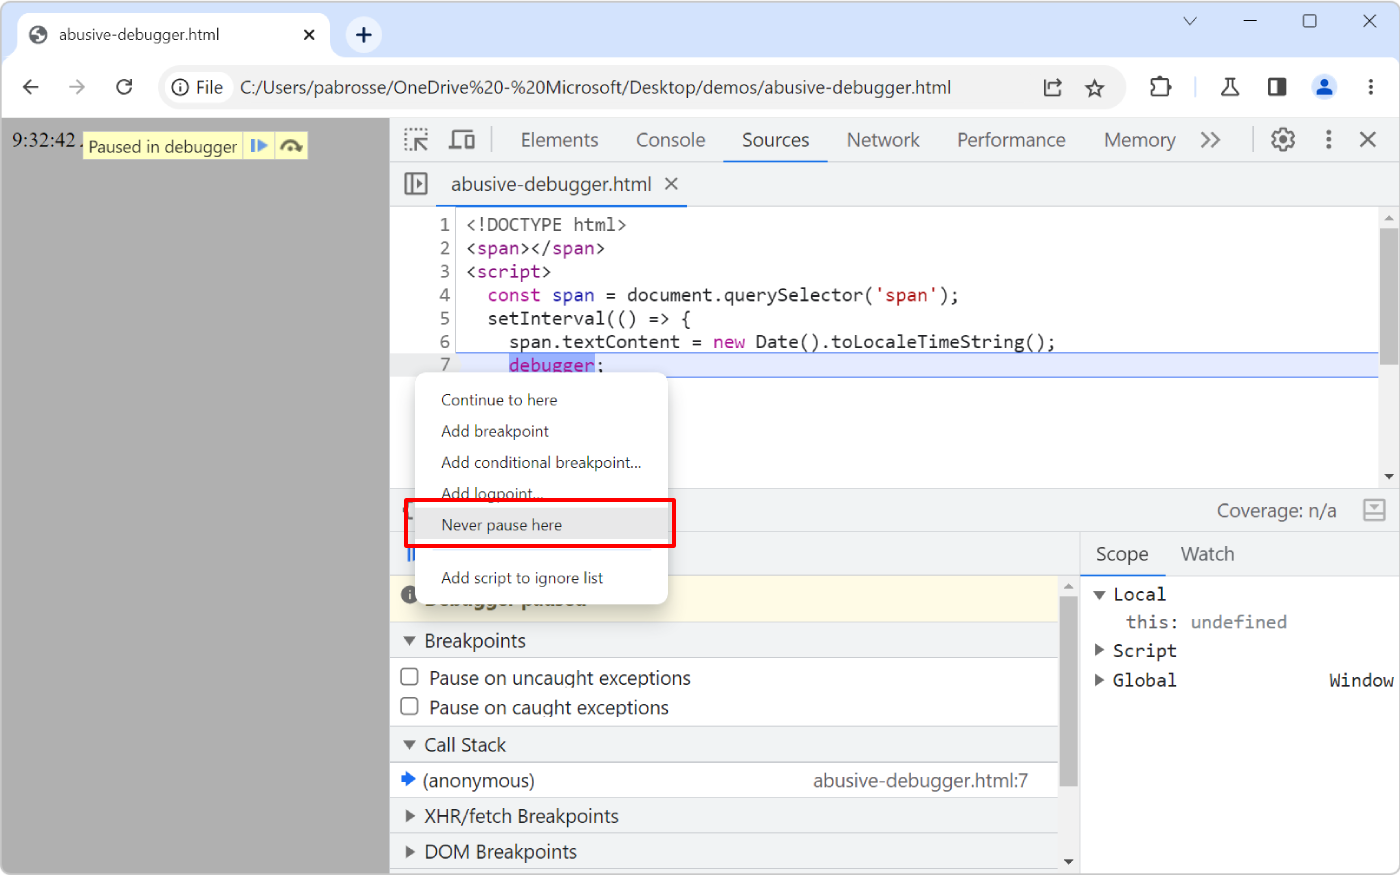
3: Disable Abusive Debugger Statements
Some websites aren’t very nice to us web developers. While they seem normal at first, as soon as you open DevTools, they immediately get stuck and pause at a JavaScript breakpoint, making it very hard to inspect the page!
These websites achieve this by adding a debugger statement in their code. This statement has no effect as long as DevTools is closed, but as soon as you open it, DevTools pauses the website’s main thread.
If you ever find yourself in this situation, here is a way to get around it:
- Open the Sources tool (called Debugger in Firefox).
- Find the line where the debugger statement is. That shouldn’t be hard since the debugger is currently paused there, so it should be visible right away.
- Right-click on the line number next to this line.
- In the context menu, choose Never pause here.
- Refresh the page.
Note: To learn more, see “Disable abusive debugger statements that prevent inspecting websites.”
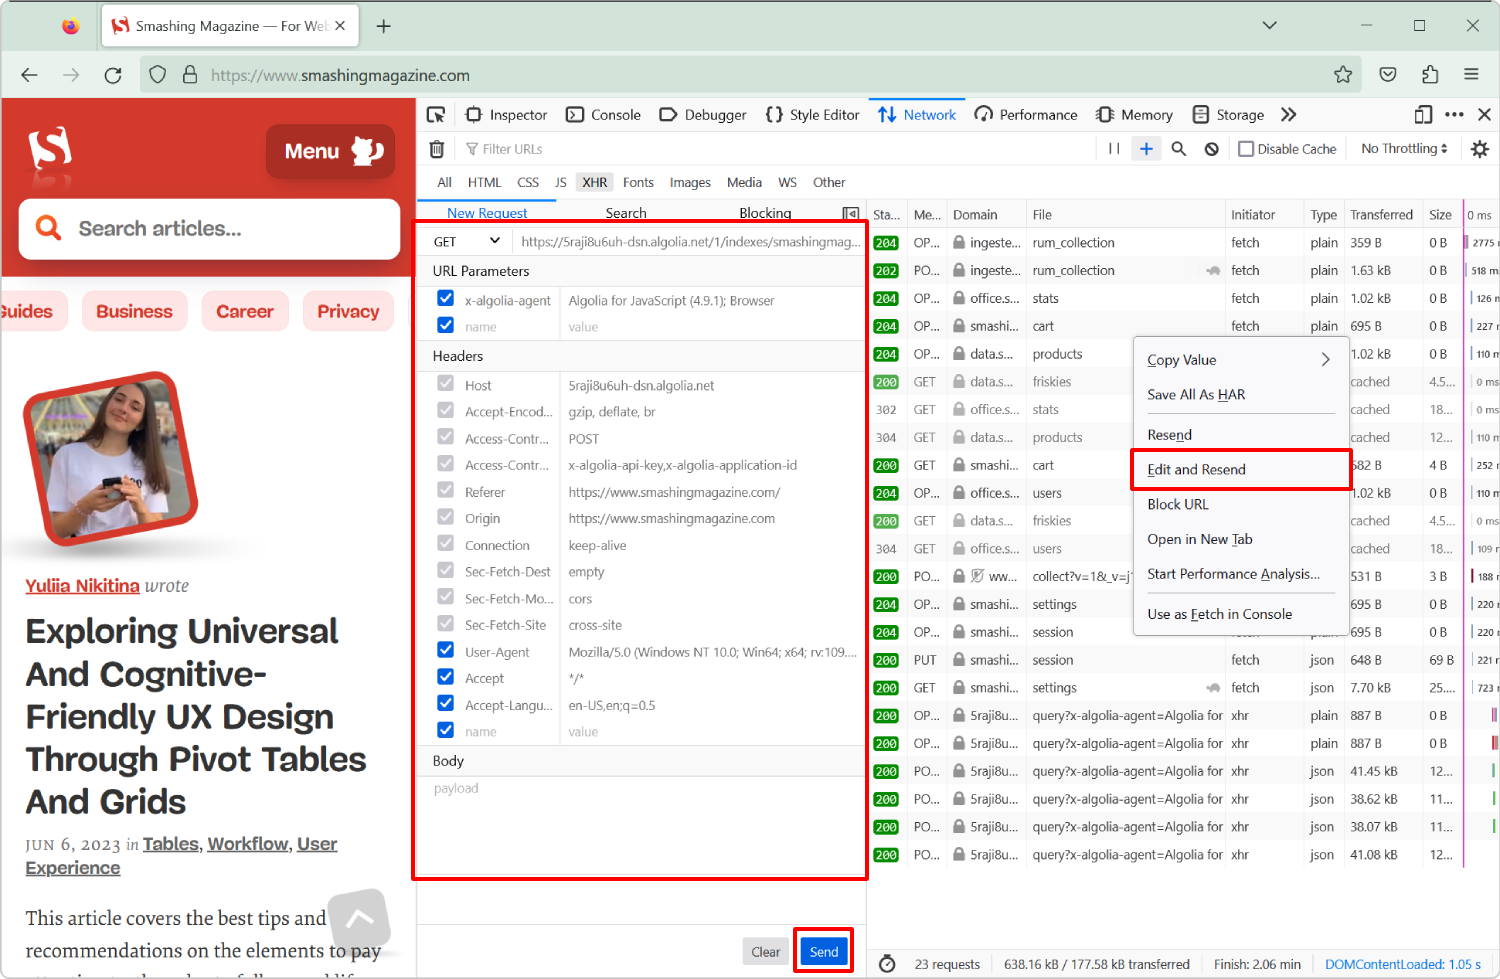
2: Edit And Resend Network Requests
When working on your server-side logic or API, it may be useful to send a request over and over again without having to reload the entire client-side webpage and interact with it each time. Sometimes you just need to tweak a couple of request parameters to test something.
One of the easiest ways to do this is by using Edge’s Network Console tool or Firefox’s Edit and Resend feature of the Network tool. Both of them allow you to start from an existing request, modify it, and resend it.
In Firefox:
- Open the Network tool.
- Right-click the network request you want to edit and then click Edit and Resend.
- A new sidebar panel opens up, which lets you change things like the URL, the method, the request parameters, and even the body.
- Change anything you need and click Send.
In Edge:
- First, enable the Network Console tool by going into the Settings panel (press F1) → Experiments → Enable Network Console.
- Then, in the Network tool, find the request you want to edit, right-click it and then click Edit and Resend.
- The Network Console tool appears, which lets you change the request just like in Firefox.
- Make the changes you need, and then click Send.
Here is what the feature looks like in Firefox:
Note: To learn more, see “Edit and resend faulty network requests to debug them.”
If you need to resend a request without editing it first, you can do so too. (See: Replay a XHR request)
And the honor of being the Number One most popular DevTools tip in this roundup goes to… 🥁
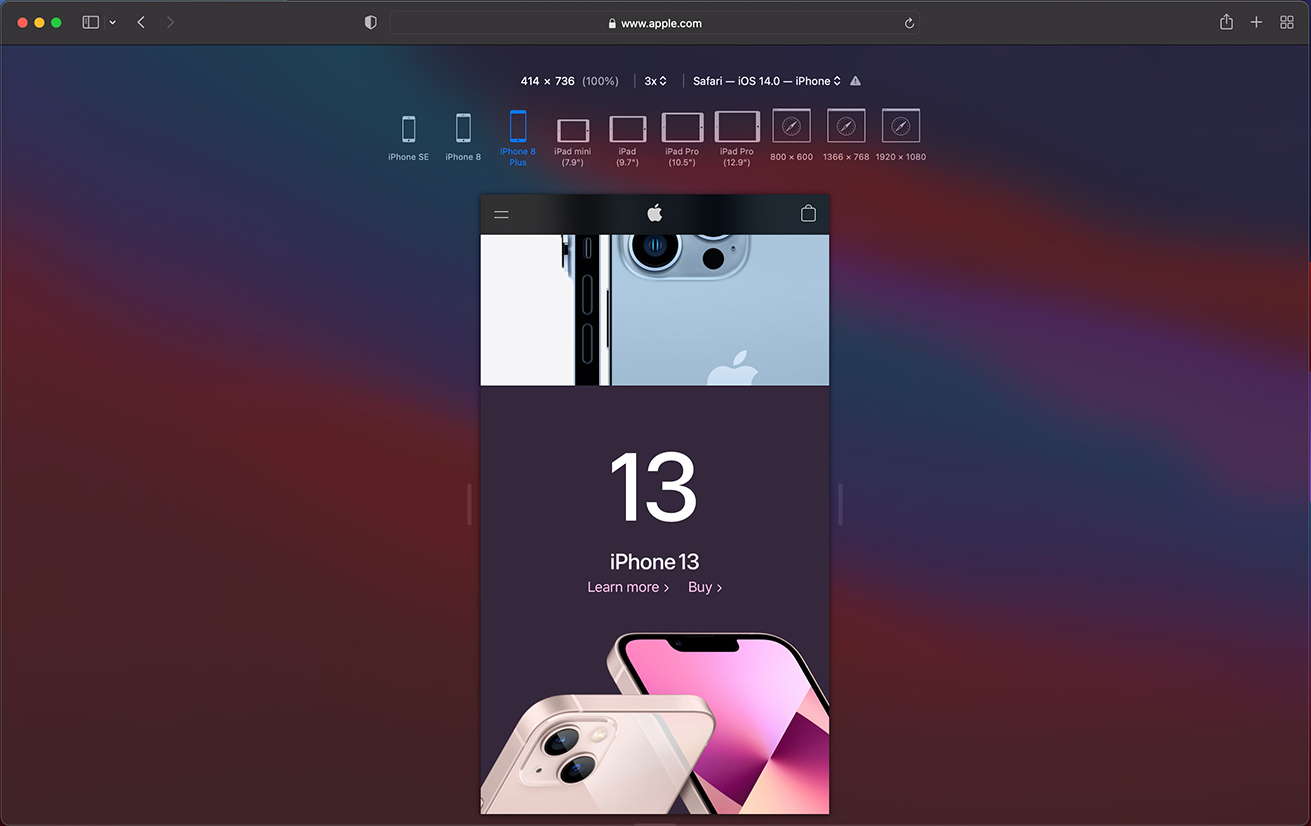
1: Simulate Devices
This is, by far, the most widely viewed DevTools tip on my website. I’m not sure why exactly, but I have theories:
- Cross-browser and cross-device testing remain, to this day, one of the most important pain points that web developers face, and it’s nice to be able to simulate other devices from the comfort of your development browser.
- People might be using it to achieve non-dev tasks. For example, people use it to post photos on Instagram from their laptops or desktop computers!
It’s important to realize, though, that DevTools can’t simulate what your website will look like on another device. Underneath it, it is all still the same browser rendering engine. So, for example, when you simulate an iPhone by using Firefox’s Responsive Design Mode, the page still gets rendered by Firefox’s rendering engine, Gecko, rather than Safari’s rendering engine, WebKit.
Always test on actual browsers and actual devices if you don’t want your users to stumble upon bugs you could have caught.
That being said,
Simulating devices in DevTools is very useful for testing how a layout works at different screen sizes and device pixel ratios. You can even use it to simulate touch inputs and other user agent strings.
Here are the easiest ways to simulate devices per browser:
- In Safari, press Ctrl+Cmd+R, or click Develop in the menu bar and then click Enter Responsive Design Mode.
- In Firefox, press Ctrl+Shift+M (or Cmd+Shift+M), or use the browser menu → More tools → Responsive design mode.
- In Chrome or Edge, open DevTools first, then press Ctrl+Shift+M (or Cmd+Shift+M), or click the Device Toolbar icon.
Here is how simulating devices looks in Safari:
Note: To learn more, see “Simulate different devices and screen sizes.”
Finally, if you find yourself simulating screen sizes often, you might be interested in using Polypane. Polypane is a great development browser that lets you simulate multiple synchronized viewports at the same time, so you can see how your website renders at different sizes at the same time.
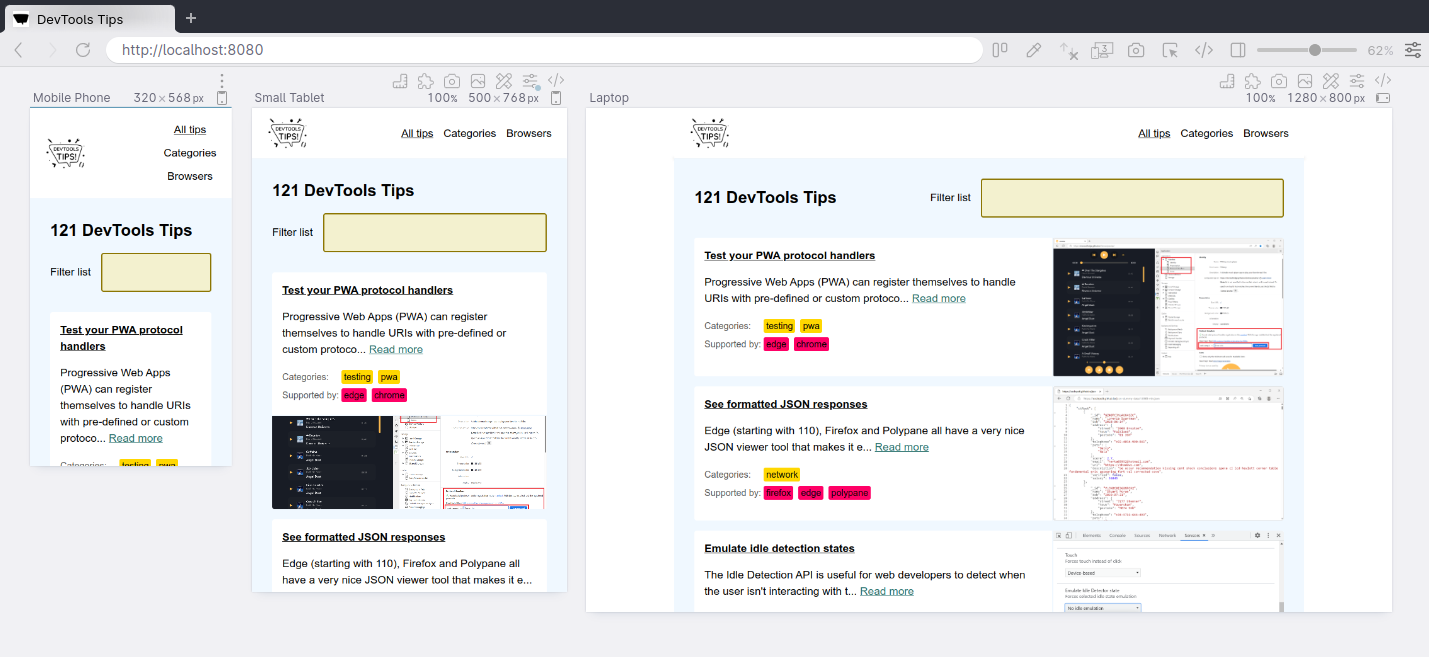
Polypane comes with its own set of unique features, which you can also find on DevTools Tips.
Conclusion
I’m hoping you can see now that DevTools is very versatile and can be used to achieve as many tasks as your imagination allows. Whatever your debugging use case is, there’s probably a tool that’s right for the job. And if there isn’t, you may be able to find out what you need to know by running JavaScript in the Console!
If you’ve discovered cool little tips that come in handy in specific situations, please share them in the comments section, as they may be very useful to others too.
Further Reading on Smashing Magazine
- “CSS Auditing Tools,” Iris Lješnjanin
- “DevTools Debugging Tips And Shortcuts (Chrome, Firefox, Edge),” Vitaly Friedman
- “Accessibility In Chrome DevTools,” Umar Hansa
- “How To Make Life Easier When Using Git,” Shane Hudson